
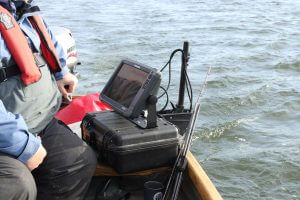
If you have bought yourself an echo sounder with built-in GPS then there is a seriously useful bolt-on that you can add to it that won’t cost you a penny, but which can give you some fascinating insights into why certain areas and spots are better than others.
I’m talking about adding topographical maps showing the underwater contours of your favourite fisheries to your sounder that can be accessed whilst you are out on the water. Such maps don’t exist for every waterbody yet, especially in the UK, but there are enough to get started and it is easy to record your own.
Until recently you normally had to pay for software to create maps. My buddy and I played around with the original Dr Depth software, which although a little tricky to use, was quite useful. Now though the major marine electronics companies have started to develop (or buy) their own online software and make this available in both free and fee-paying formats. This is great news for the Consumer as, in my experience, the free versions are good enough to offer a great deal of useful information.
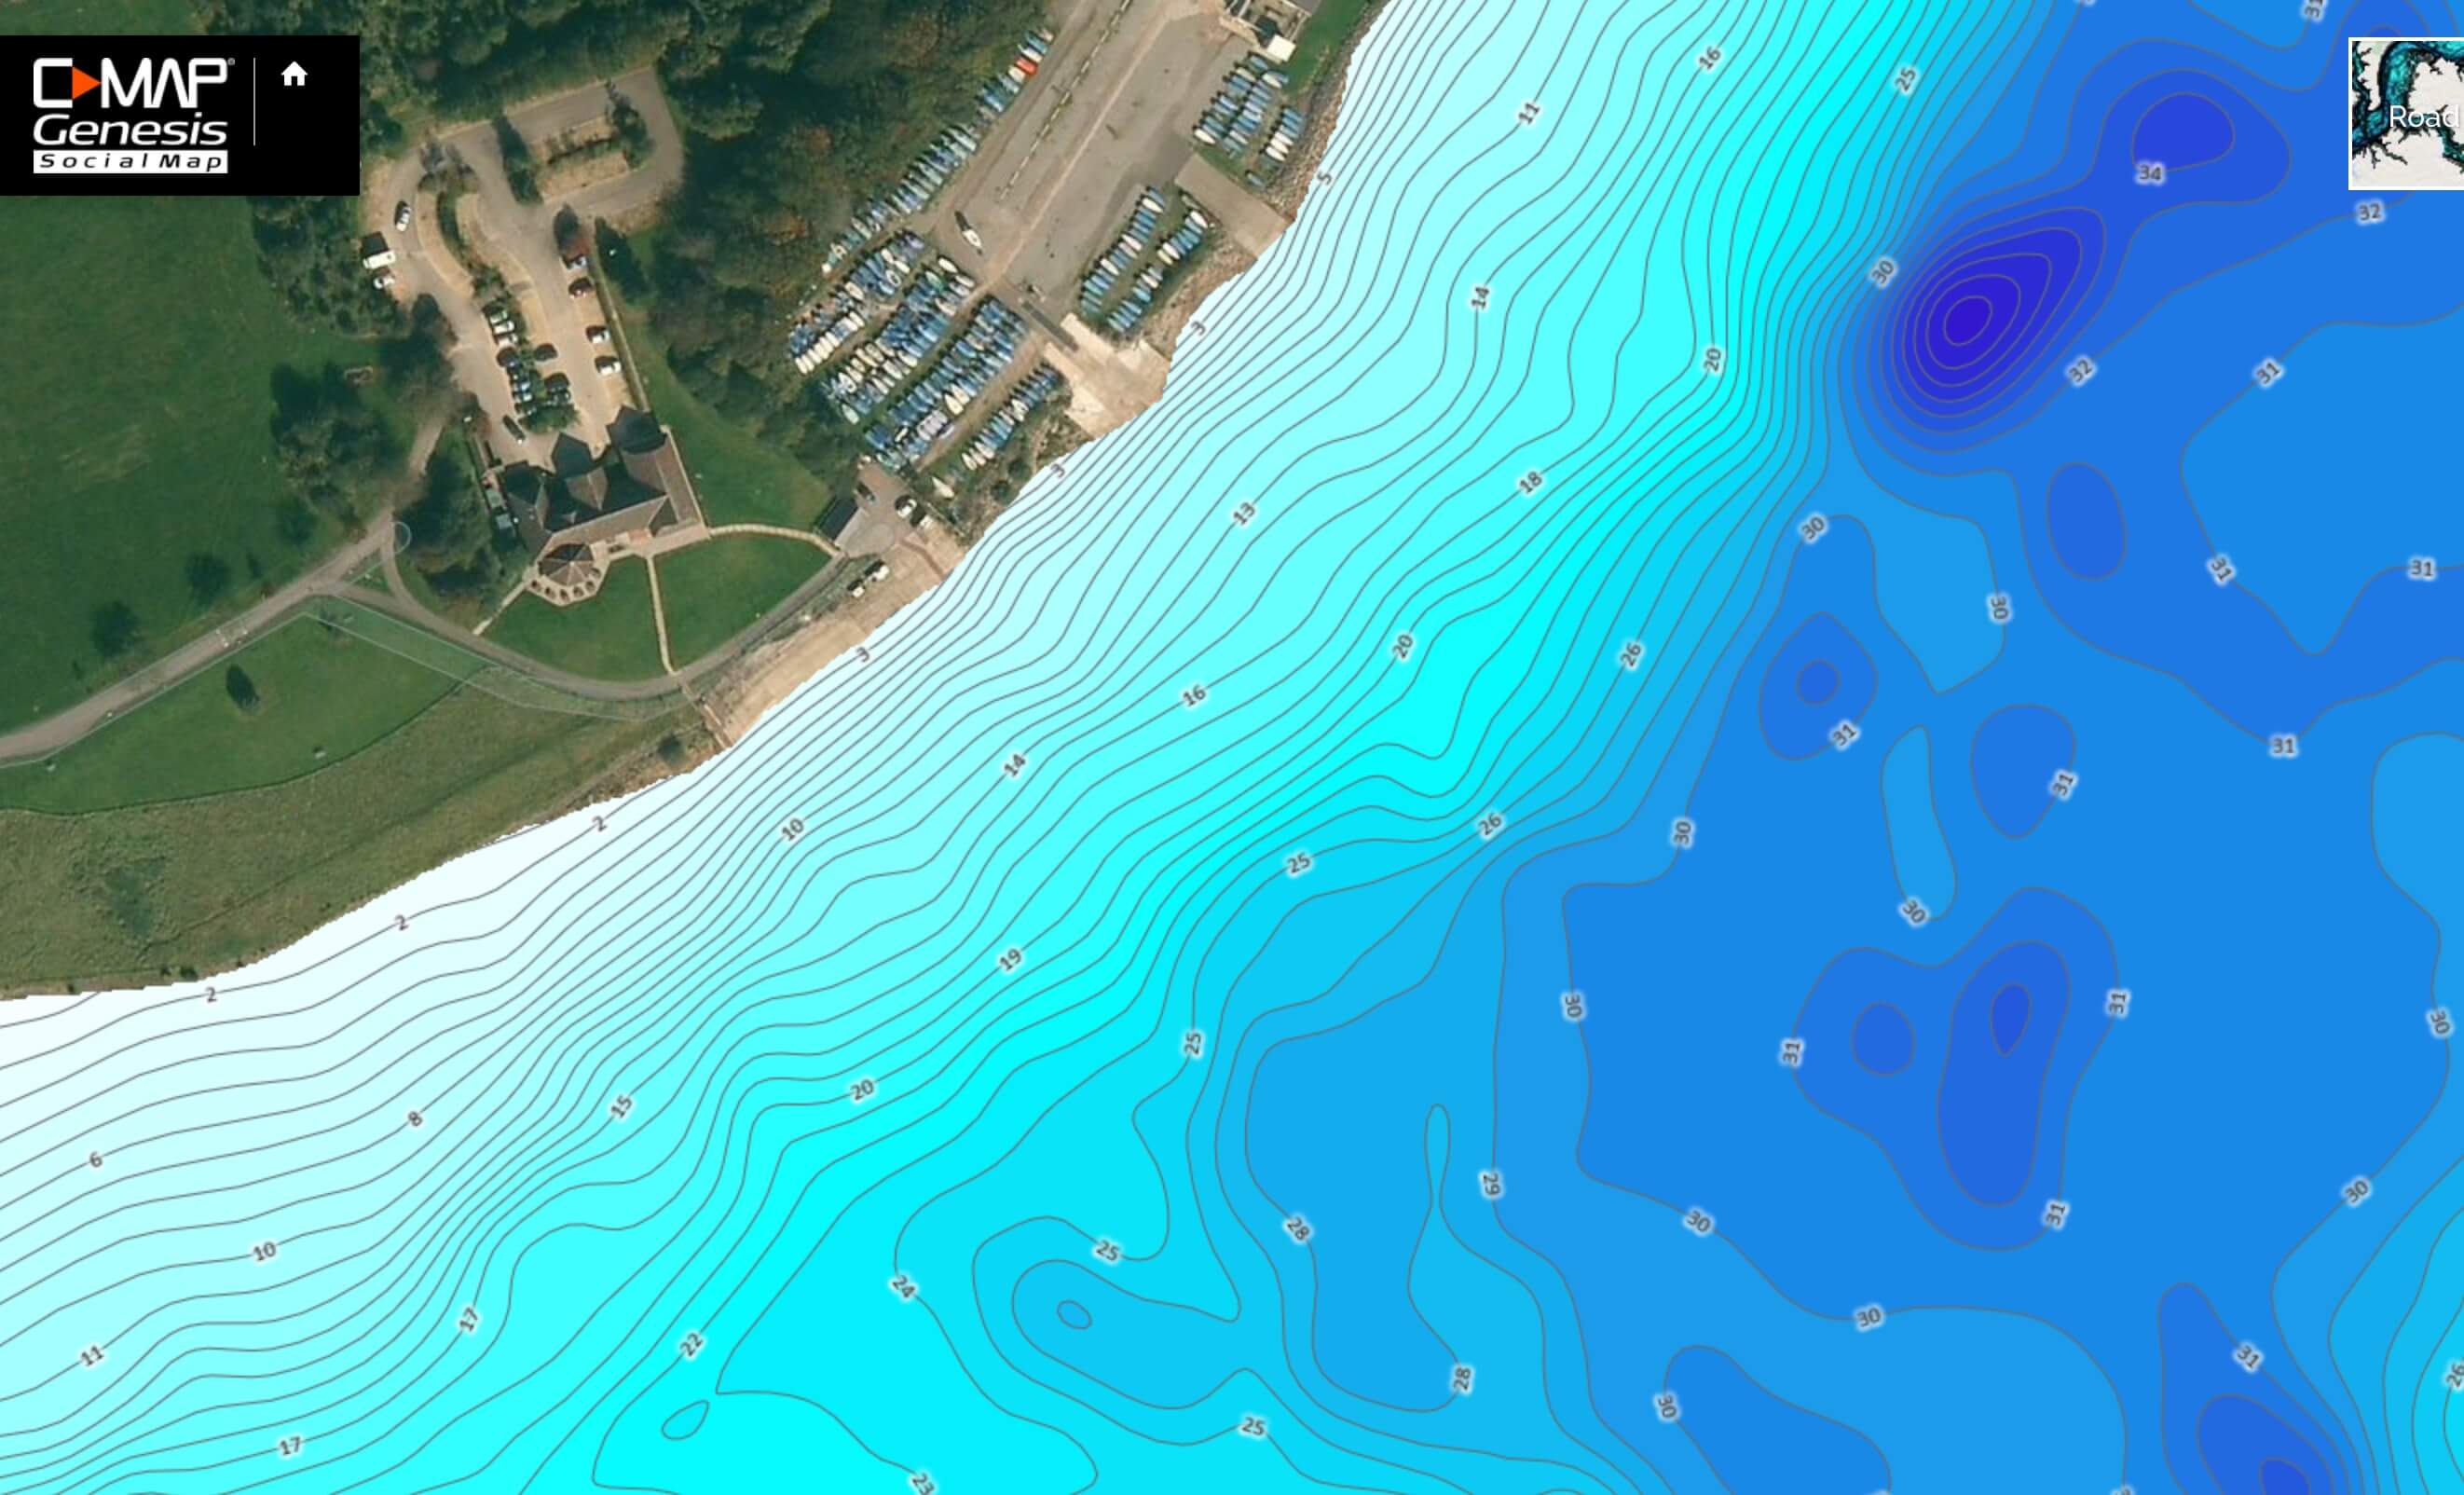
I am a Lowrance user, so will talk about their site, which goes by the rather convoluted name of CMAP Genesis (www.genesismaps.com). Here you can upload your own data and let the people behind the site integrate the information into the online maps, or you can just download the maps created using other people’s data for free. There is a fee-charging version, which allows you to keep your data private, which if you are fishing secret venues may well be important to you. I must admit, the first thing I did when I started looking at the Community maps was see which venues had been mapped!
A lot of the major reservoirs have been mapped, along with some of the glacial lakes and lochs / loughs. The maps look great, but one thing I would advise is that the level of detail is not always apparent from the map. What happens is the software interprets the data uploaded and extrapolates this over quite a wide area. For example, if you were to make parallel runs up and down a lake at 100ft intervals then the software will simply ‘join the dots’ and fill in the missing information. Within that 100ft could be a ridge or stream bed – a significant feature, but one that would not show up on the map.
There’s a great FREE bolt-on for your sounder.
Of course, the more of us who upload data to the site the more accurate the maps will eventually become. You can set your sounder to record data at any time quite simply and then when you get home upload this data to the site for processing. Full instructions are on the site, but really it is pretty simple. One thing I would advise is to start a new recording about once an hour to keep the file sizes reasonable.
I reckon that at trolling speed you can cover a fair bit of water in a day and map accordingly. I spent a day specifically doing this on one venue, using the trail-overlay on my GPS to ensure that I covered the water as effectively as possible (with the least amount of duplication) and managed about 100 acres at a fair resolution. I already knew the lake pretty well from a few years fishing it, so didn’t learn anything especially new, but it certainly confirmed the view that I had in my head.
It can take a few weeks for your data to appear on the community map (I don’t know if the fee-paying version is any quicker), but sooner or later it will appear and you can simply download the map onto your computer. From there save it on to a memory card and insert this into one of the card slots on your sounder. The next time you switch on the sounder it will prompt you whether you want to use any of the available maps that are saved on the card.
Having a relief map of a venue that you have never fished before can obviously be a big advantage, taking a lot of guess-work out before you even visit. On venues that you have fished quite a bit then the insight can be just as useful.
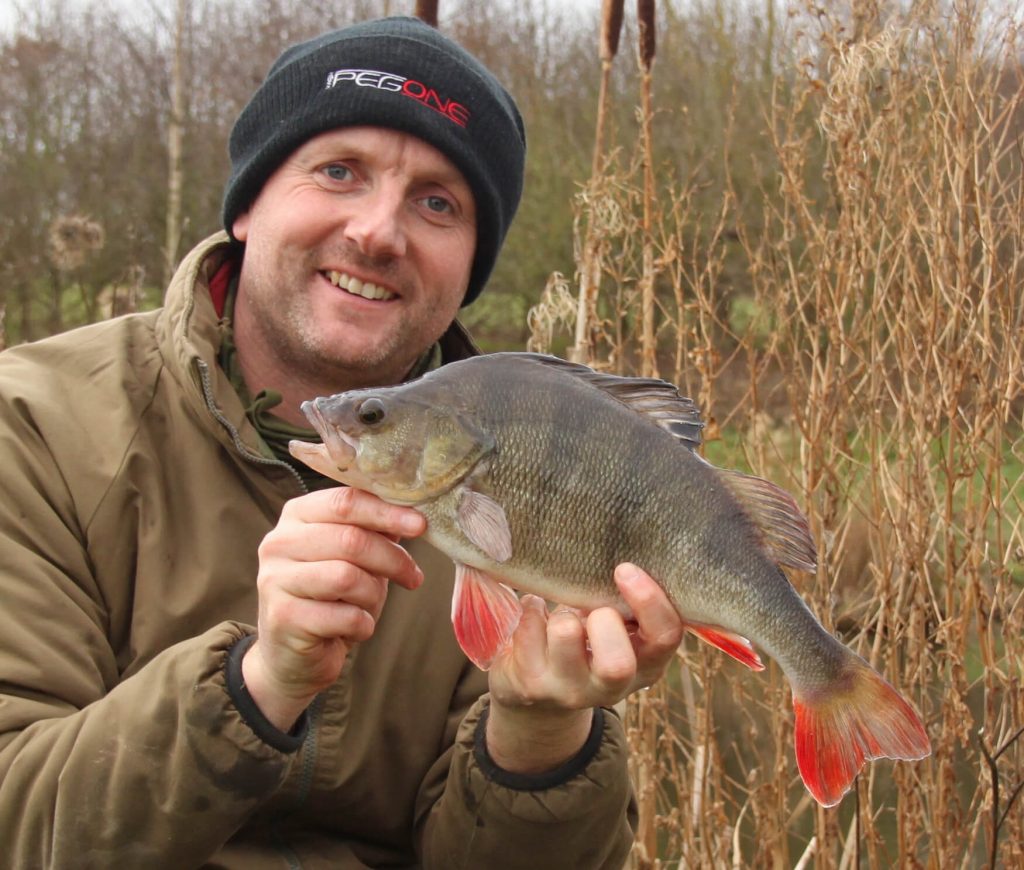
Obviously, you will be marking spots on your GPS at which you have caught fish and over time this can build up to a lot of useful information. By combining your fish marks with the downloaded map for the venue you can now start to look for patterns and perhaps spot trends or the fine detail that creates a hotspot within an area. I have certainly looked at my data very differently since I have started to do this and, believe me, it has given me an insight into why certain small areas seem to have a very consistent track-record. But that, as they say, is a story for another time ….
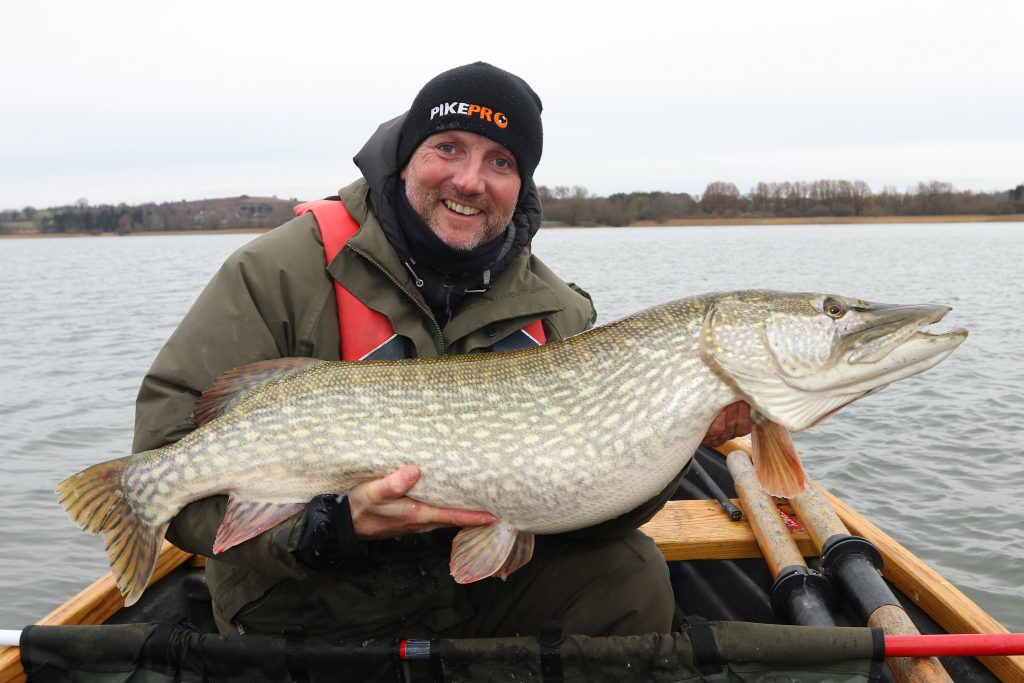
A big pike caught from a marked spot, the contour map helps explain why it is a hotspot.
No Comments